सिक्स सिग्मा परियोजनाओं में सांख्यिकीय प्रक्रिया नियंत्रण (एसपीसी) का अनुप्रयोग
Statistical Process Control (SPC) is a data-driven methodology for monitoring, controlling, and improving manufacturing processes. At its core, SPC distinguishes between common-cause (natural) variation and special-cause (assignable) variation, alerting engineers when a process departs from its normal range. By collecting real-time data and plotting it on statistical charts, SPC transforms quality control from a reactive fire-fighting approach into a proactive, continuous-improvement discipline. Originating with Walter A. Shewhart in the 1920s, SPC’s control charts (sometimes called Shewhart charts) remain the heart of the method.
Core SPC Tools: Control Charts and Capability Analysis
Control Charts
Control charts graph process data over time with upper and lower control limits (typically set at ±3σ) and a centerline at the process mean. Figure 1 illustrates a typical X-bar and R chart used in manufacturing.
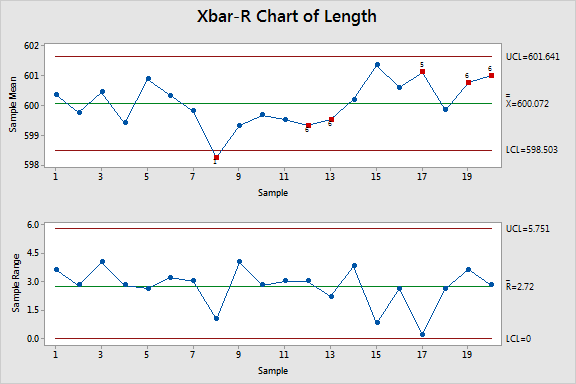
Figure 1: Example of an X-bar and R control chart for part lengths. The top chart plots subgroup means with centerline (green) and control limits (red); the bottom chart plots the subgroup range. Points marked in red are outside control limits (special-cause signals). Such charts help teams detect when a process shifts beyond normal variability.
In Figure 1, the X-bar chart tracks the average of each sample (e.g. subgroup of parts), while the R chart tracks the range (variability) of those samples. If all points remain within the red limits and display random patterns, the process is considered in control. Any point outside the limits—or nonrandom patterns within them—signals a special cause that should be investigated. Common control chart types include the X-bar/R chart for variable measurements with subgroups, the I-MR chart for individual observations, and p/C/u charts for attribute (pass/fail or count) data. (Table 1 summarizes typical chart types and uses.).
Click HERE for Quality Management, Engineering, ISO Management Systems, Lean Six Sigma & Process Improvement Training Courses
| Chart | Definition | Use Case |
|---|---|---|
| I-MR (I) Chart | Individual data points charted with moving-range (MR) of successive differences. | Single measurements taken one at a time (e.g. manual measurements, cycle time). |
| X-bar & R | Upper chart of subgroup means (X-bar) and lower chart of subgroup ranges (R). | Continuous data grouped into small rational subgroups (e.g. 5 parts per sample). |
| X-bar & S | Similar to X-bar & R, but charts means and subgroup standard deviations (S). | Continuous data with larger subgroup sizes (e.g. ≥10) for more precise variability tracking. |
| p Chart | Plots fraction or percentage of defective items in each sample. | Attribute data (pass/fail) where sample sizes may vary (e.g. % of faulty widgets per batch). |
| np Chart | Plots count of defective items in each sample (constant sample size). | Attribute data with fixed sample size (e.g. number of bad units in each pack of 100). |
| c Chart | Plots count of defects per unit (of varying or constant size). | Defects in a continuous area or a given unit (e.g. surface blemishes per sheet). |
| u Chart | Plots defects-per-unit controlling for varying sample sizes. | Defects per unit when sample size varies (e.g. scrap pieces per meter of material). |
In addition to control charts, SPC relies on other tools. Histograms visualize data distribution, Pareto charts prioritize the most frequent defects, and cause-and-effect (Ishikawa) diagrams help trace sources of variation. These tools complement control charts by summarizing data and guiding root-cause analysis. For example, an histogram can confirm whether data are approximately normal (a common assumption for many variable control charts), and a Pareto chart can focus a team on the few defects that account for most failures.
Click HERE for Quality Management, Engineering, ISO Management Systems, Lean Six Sigma & Process Improvement Self-paced Training Courses
Process Capability Analysis
Once a process is in statistical control, process capability analysis quantifies how well it meets engineering specifications. Capability indices like Cp and Cpk compare the process spread and centering to the specification limits (USL and LSL). In other words, capability analysis answers: “If the process continues in control, what fraction of parts will be out of spec?”
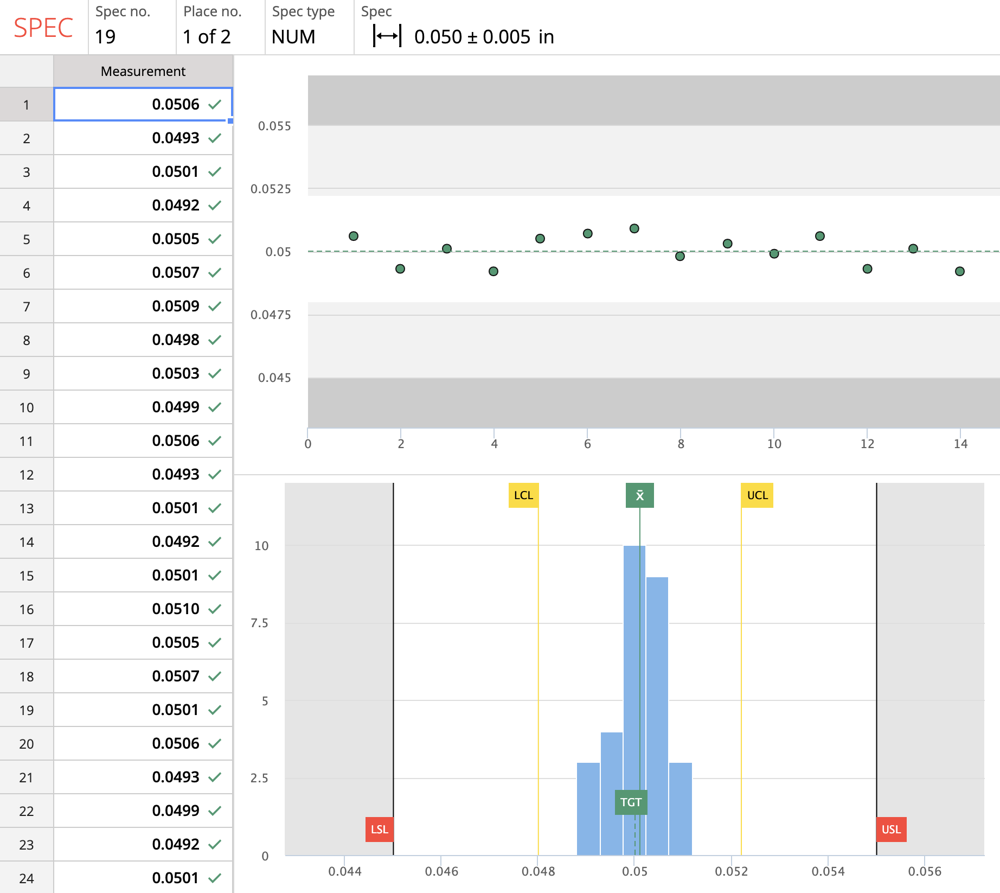
Figure 2: Process capability analysis in SPC. A run chart (top-right) and histogram (bottom-right) show a process centered near the target (TGT) with lower (LCL) and upper (UCL) control limits. Spec limits (LSL, USL) define acceptable tolerance. The process capability indices (Cp, Cpk) measure how the green distribution fits within the red USL/LSL boundaries.
Figure 2 illustrates capability analysis: green data points lie mostly between the red Lower/Upper Spec Limits (LSL/USL). If the process average (centerline) is well-centered and the spread (variance) is narrow, Cp and Cpk will be high (e.g. >1.33), indicating a capable process. Capability analysis is crucial in manufacturing: it ensures that a process not only is stable (in control) but consistently produces parts within tolerance. In Six Sigma projects, capability indices often serve as key metrics (e.g. aiming for Cpk ≥ 1.33 or Six Sigma quality) to verify that improvements meet customer requirements.
Integrating SPC into the DMAIC Framework
In Six Sigma’s DMAIC cycle, SPC tools are woven throughout the project phases to guide decisions and sustain gains.
- Define: During project definition, teams use SIPOC diagrams, voice-of-customer data, and CTQ (Critical-To-Quality) trees to identify the key process outputs to monitor. While control charts are not used yet, the CTQs established here (e.g. defect rate, part dimension) will become the variables plotted on charts later.
- Measure: SPC is introduced early in Measure to establish a baseline process behavior. After selecting the appropriate control chart for the data type and subgroup size, the team collects initial data and calculates control limits. Gage R&R (measurement system analysis) should verify that measurement instruments are reliable before trusting the data. Plotting the data on control charts immediately reveals whether the current process is in control or if special causes exist.
- Analyze: In the Analyze phase, SPC charts highlight where and when defects occur. Any out-of-control signals point to special-cause variation that warrants root-cause analysis. Teams use tools like Pareto charts and fishbone diagrams on the data flagged by control charts to pinpoint root causes (e.g. a spike in defects during a specific shift). For example, a control chart might reveal a cluster of high values; a Pareto chart could then identify the most common defect type responsible for that cluster, and a fishbone diagram may trace it to equipment wear or material change. Regression or correlation analysis can further relate process outputs to inputs (e.g. temperature, pressure) suspected of causing variation.
- Improve: After identifying root causes, teams implement solutions and use SPC charts to verify their effect. When process changes are piloted (for instance, adjusting a machine setting or introducing a poka-yoke fixture), new data are added to the control chart. A returning to “in-control” signals and reduced variability indicate that the fix worked. Design of Experiments (DOE) may be used to optimize multiple factors simultaneously, and control charts then track the best conditions. For example, if a factory changes supplier or re-calibrates a machine, an X-bar chart of output diameter after the change shows whether the process mean stabilizes within target.
- Control: In the Control phase, SPC tools become the final safeguard. Control charts are maintained on the key metrics to ensure the process stays within limits over time. The team develops a control plan documenting which charts to use, data collection frequency, and response actions if a signal appears. Process Capability analysis is repeated on the improved process to confirm it reliably meets specifications (e.g. achieving a target Cpk). Standard work, SOPs, and 5S organization support these controls, and periodic audits or management reviews of the SPC charts help sustain improvements.
By aligning SPC with DMAIC, Six Sigma projects ensure that improvements are statistically verified and locked in. As one expert notes, “Control charts are used primarily in the Measure and Control phases but support all DMAIC phases when paired with tools like process maps and Pareto charts”. In sum, SPC charts transform raw process data into actionable insight at every stage of a Six Sigma project.
Click HERE for Quality Management, Engineering, ISO Management Systems, Lean Six Sigma & Process Improvement Self-paced Training Courses
Benefits of Integrating SPC into Six Sigma (Manufacturing Focus)
When applied within a Six Sigma approach, SPC delivers substantial benefits in manufacturing settings. Among the key advantages are:
- Proactive Quality Control: SPC shifts quality management from reactive inspections to proactive monitoring. By detecting trends or out-of-control points early, teams can correct processes before defects escalate. This reduces scrap, rework, and downtime. For example, real-time SPC charting on a production line alerts operators immediately when a process drifts, preventing batches of bad parts.
- Waste Reduction and Cost Savings: Continuous monitoring sharply cuts waste. Industry reports attribute multi-billion-dollar savings to SPC-driven Six Sigma initiatives: Motorola, for instance, saved roughly $17 billion in waste reduction over ten years by incorporating SPC and Six Sigma. Ford Motor Company saw its defect rate drop by 90%, translating into hundreds of millions in savings. Even small improvements compound; one packaging plant halved its scrap by adopting real-time SPC software to eliminate measurement errors.
- Improved Process Capability: SPC plus Six Sigma rigor ensures processes consistently meet specifications. Capability indices and control charts confirm that variation is minimized and centered on the target. This leads to higher first-pass yield and fewer customer rejects. For example, General Electric reports a $12 billion increase in revenue after broad adoption of SPC within its quality programs. In practice, factories using SPC routinely achieve capability index goals (e.g. Cpk > 1.33) that might otherwise be unattainable without precise statistical control.
- Higher Customer Satisfaction: With defects curtailed and process consistency improved, customer quality ratings rise. American Express (as cited in Six Sigma training) increased its customer satisfaction by 20% after applying SPC to its critical financial processes. In manufacturing, this translates to fewer warranty claims and stronger brand reputation.
- Continuous Improvement Culture: Embedding SPC reinforces a data-driven culture. Teams become accustomed to using real data (not gut feel) to drive decisions. Operators and engineers learn to interpret charts and engage in continuous monitoring. Over time, SPC tools become a routine part of standard work, making quality everyone's responsibility.
Collectively, these benefits make SPC a cornerstone of manufacturing excellence in Six Sigma. By linking statistical monitoring to process improvement, organizations turn variability into insight, driving efficiency and profitability.
Challenges and Mitigation Strategies
Implementing SPC within Six Sigma is not without hurdles. Common challenges and their solutions include:
- Lack of Understanding/Training: SPC concepts (control charts, limits, statistical tests) can be abstract to frontline staff. Misinterpretation of charts can lead to false alarms or missed signals. Solution: Invest in training and mentorship. Pair inexperienced team members with seasoned Black Belts or quality engineers, and use simple examples to teach chart reading. Promote a continuous-learning culture so that everyone understands common-cause vs special-cause. Documented procedures and cheat-sheets can help reinforce correct usage.
- Resistance to Change: Operators may resist new SPC procedures out of habit or skepticism. Solution: Involve them early. Explain the tangible benefits (reduced rework, easier problem solving) and show quick wins. A structured change management plan, with clear communication and participation, can ease the transition. Celebrate improvements to build buy-in.
- Poor Data Quality or Measurement: SPC depends on reliable data. Uncalibrated instruments or inconsistent sampling can undermine charts. Solution: Conduct Gauge R&R studies to quantify measurement error. Standardize data collection methods (e.g. fixed sampling intervals, clear checklists) and implement regular audits or data reviews. Ensure that every measurement event records the context (machine, operator, material) to trace any issues.
- Over-Complex Implementation: Attempting to SPC every process or analyze too many variables at once can overwhelm teams. Solution: Start small. Break complex processes into simpler subprocesses and tackle them one by one. Focus SPC on the critical few characteristics (the CTQs) that have the biggest impact on quality. Use dashboards or roll-up charts to consolidate information from multiple SPC tools, so managers see only key trends.
- Misplaced Priorities: Treating SPC as a “checkbox” activity rather than a living process can blunt its impact. Solution: Integrate SPC goals into the project charter and management reviews. Assign clear ownership for monitoring each chart and define the response plan when limits are breached. Regularly revisit control charts in meetings to ensure they remain relevant.
By anticipating these challenges and proactively addressing them (through training, planning, and leadership support), organizations can realize the full benefits of SPC within their Six Sigma initiatives.
Click HERE for Quality Management, Engineering, ISO Management Systems, Lean Six Sigma & Process Improvement Self-paced Training Courses
Case Studies and Real-World Examples
Manufacturers around the world have applied SPC within Six Sigma with impressive results:
- General Electric (Conglomerate): GE began rigorous SPC and Six Sigma in the 1990s. By enforcing control charts and capability studies in its factories and services, GE boosted quality across products. Reportedly, GE achieved over $12 billion in increased revenue and $1.5 billion in cost savings through these quality programs.
- Motorola (Electronics Manufacturing): Motorola pioneered Six Sigma and SPC integration. In the mid-1980s, facing heavy Japanese competition, the company mandated SPC charts on critical lines. Over ten years, Motorola credited about $17 billion in waste reduction from its SPC/Six Sigma deployment.
- Ford Motor Company (Automotive): Applying SPC in assembly plants, Ford slashed its defect rate by 90% in the early 2000s, saving roughly $300 million in two years. Control charts were used on engine components and paint processes to catch issues in real time.
- Toyota (Automotive): Renowned for quality, Toyota has long used SPC on its production lines. Engineers have reported that early detection of process drifts via control charts significantly reduced defects and recalls. Toyota’s approach combines SPC with Kaizen and standardized work: as problems are spotted on control charts, cross-functional teams immediately address root causes, sustaining a cycle of improvement.
- Boeing (Aerospace): In aviation manufacturing, safety and precision are critical. Boeing implemented SPC for key production metrics (e.g. wing dimensions, fuselage alignment) to comply with strict quality standards. Real-time control charts allowed engineers to catch subtle deviations early. As a result, Boeing reduced rework and scrap costs, while maintaining tight process control.
- Green Bay Packaging (Corrugated Packaging): At a Tulsa box plant, operators had been making control charts by hand. After switching to real-time SPC software, Green Bay Packaging could plot data instantly and overlay specification limits on histograms. This automation dramatically cut errors and data lag. They reported significant reductions in variability, scrap material, and overall costs after SPC software implementation.
These examples span diverse manufacturing sectors but share a common theme: systematic SPC yields measurable quality and financial gains. Table 2 summarizes selected outcomes:
| Company / Industry | Outcome | Source |
|---|---|---|
| General Electric | +$12B revenue; $1.5B cost saved via SPC/6σ | |
| Motorola | $17B waste reduction over 10 years (from SPC/6σ) | |
| Ford Motor Co. | 90% defect rate reduction; ~$300M saved | |
| Toyota | Early detection of process variation; defect reduction | |
| Boeing | Real-time control charting; lower rework and scrap | |
| Green Bay Packaging | Reduced process variability, scrap, and costs |
Table 2: Examples of SPC/Six Sigma successes in manufacturing industries.
Practical Recommendations for SPC Implementation
For Six Sigma teams aiming to leverage SPC effectively, the following guidelines can help ensure success:
- Align SPC with Project Goals: Begin by defining clear objectives (e.g. reduce cycle time variation, achieve Cpk ≥ 1.33) and identifying the CTQs (critical quality attributes) for the process. Use SIPOC maps and CTQ trees to link customer requirements to measurable variables. Ensure that control chart variables directly reflect these project goals.
- Ensure Robust Data Collection: Develop a data collection plan before plotting charts. Determine sampling frequency, subgroup size, and measurement units. Perform Gauge R&R studies to confirm that your measurement system is precise and accurate. Only use data generated under a stable process; if the process is not yet in control, use preliminary data only to establish limits after stabilization.
- Choose Appropriate SPC Tools: Select control charts based on the data type and subgroup structure. For continuous data in subgroups, X-bar/R or X-bar/S charts are typical; for individual measurements, use I-MR charts. For attribute data, use p-, np-, c-, or u-charts as summarized in Table 1. Match the chart to the nature of variation (e.g. defect counts vs. proportions). Also plan for capability studies (Cp, Cpk) once control is achieved.
- Collect Baseline Data and Plot Charts: Gather an initial batch of data (often 20–25 points) and compute control limits. Plot these on the chosen chart(s). Verify in control by checking for any out-of-control signals. If signals exist, investigate root causes first before declaring the process stable. This baseline SPC analysis establishes your current process capability.
- Train the Team: Provide SPC and Six Sigma training to all stakeholders. Include operators, technicians, and managers. Make sure everyone can read the charts, understand the control limits, and know what to do when an out-of-control point appears. Training should also cover complementary tools: for example, teach Pareto analysis and fishbone diagrams to use when charts signal problems.
- Implement Changes Iteratively: When testing improvements, use a pilot approach. As changes are made, continue plotting on the control chart. A successful improvement should cause the chart to return to control (no red points) and ideally reduce the overall variability. If multiple factors are being optimized, consider a DOE and then use SPC charts to confirm the best settings.
- Establish Control Plans and Documentation: Develop a formal control plan that specifies: which metrics to monitor, what charts to use, sampling frequency, data owners, and response actions if a chart signals. Update standard operating procedures (SOPs) and training documents accordingly. Automate SPC where possible: use software (Minitab, JMP, or built-in SPC systems) to generate charts and alerts. Dashboard tools can synthesize multiple chart results for management.
- Review and Sustain: SPC is not a one-time activity. Schedule periodic reviews of the control charts as part of regular process audits or management reviews. If the process evolves (new equipment, different shift patterns), re-validate the charts. Always use SPC feedback to trigger continuous improvement (feeding back into future DMAIC projects).
By following these steps—defining clear objectives, ensuring data integrity, selecting and maintaining the right charts, and embedding SPC into control plans—teams can make SPC an integral part of their Six Sigma quality infrastructure. The synergy between SPC and DMAIC accelerates problem-solving and locks in gains: “by aligning control charts with DMAIC phases and tools, organizations can uncover root causes, implement solutions, and sustain improvements”.
Click HERE for Lean Six Sigma & Process Improvement Self-paced Training Courses
- Lean Six Sigma Yellow Belt Certification Course
- Lean Six Sigma Green Belt Certification
- Lean Six Sigma Black Belt Certification
- Lean Manufacturing Certification Course
- Six Sigma for Manufacturing & Operational Efficiency
- Statistical Process Control (SPC) Training Course
- Measurement Systems Analysis (MSA) Training Course
- Strategic Supply Chain Management Training Course
- Operational Risk Management Training Course
- Quality Management Training Course
- Health, Safety and Environment (HSE) Training Course
- Industrial Process Automation Training Course
- Advanced Digital Manufacturing & Product Design Technologies Training Courses
- Advanced Digital Manufacturing & Product Design Technologies Training Courses
- Integrated Management Systems (IMS) Implementation Masterclass
- Integrated ISO Management Systems (IMS) Audit – Best Practices
- ISO 19011: Auditing Management Systems – Techniques & Best Practices
- ISO 9001 Quality Management Systems Lead Auditor
- ISO 14001 Environmental Management Systems Lead Auditor
- ISO 45001 Occupational Health & Safety Lead Auditor
- ISO 50001 Energy Management Systems Lead Auditor
- Food Safety Management Systems (FSMS) Implementation
- ISO 22000 Food Safety Management Systems Lead Auditor
- FSSC 22000 Lead Auditor (Food Safety)
- ISO/IEC 17025 Laboratory Management Systems (LMS) Certification
- Laboratory Management Systems (LMS) Essentials
- Safety Instrumented System
- Hazards and Operability Study (HAZOP)
- Layer of Protection Analysis (LOPA)
- Quantitative Risk Assessment (QRA)
- Process Safety Management (PSM)
- Industrial Process Safety