6 Process Improvement Tools to Effectively Optimize your Operations
Process Improvement is simply a proactive approach of identifying, analyzing and improving upon existing processes within an organization in order to meet new quotas, best market standards or quality and improve customer experience. It is the task of identifying opportunities for improvement in the business process for optimization.
Process improvement is an essential task in organizations having Lean Six Sigma as one of the means for achieving incremental improvement to the business process. Process improvement efforts entail a systematic approach that adheres to some structured methodology that brings about more efficient outcome.
Process improvement aims to eliminate weak points or bottlenecks in business processes. Process improvement may involve a sequence of actions to attain new goals or objectives, including:
- Improving performance,
- Improving quality,
- Reducing costs,
- Increasing profit margin.

This article identifies 3 major process improvement techniques, these are:
- FMEA
- Prioritization Matrix
- Inter-relationship Digraphs
- Value-Stream Mapping
- SMED
- Spaghetti Charting
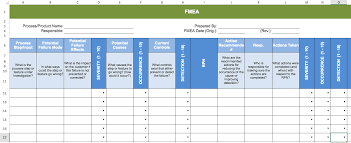
Failure is a state or condition of a system, process or product not meeting a desirable or intended objective. It is the termination of the ability of a system or product in performing its required purpose, with an overall effect on the users. Failure mode refers to the means or ways in which a system, process or product might fail. Effect analysis is the decomposition of those failures into components or segments for careful examination.
Altogether, Failure Mode and Effect Analysis (FMEA), refers to a step-wise approach in systematically analyzing all component failures in systems, methods, processes and products, and identifying the resulting effect on the system, process and/or product, which have an overall impact on the end users, with the sole aim of proffering workable solutions to them.
FMEA is used in design process to forecast and build-in failure resistance in processes and systems. It is a living document of knowledge and actions relating to failure risks for use in continuous process and/or system improvement. Failure Mode and Effect Analysis (FMEA) takes into account the seriousness of failures and how frequently they occur. Thus, it works to eliminate or reduce failures, starting with the most urgent. It is most effectively applied before failure occurs.

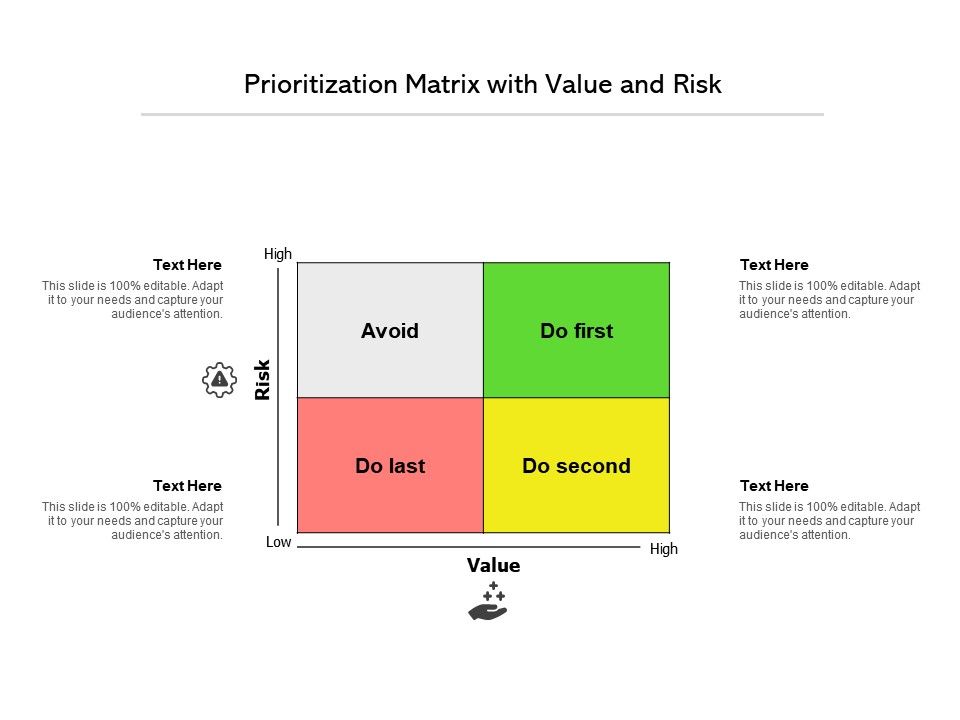
Prioritization matrices provide a mechanism for ranking the relative importance of ideas or issues that assists in deciding what to do after key actions or Critical-To-Quality (CTQ) characteristics have been identified but their relative importance is not known with certainty.
It is a visual diagram used to compare multiple (at least two) sets of data using some sets of criteria. The matrix consists of a set of criteria options and the alternatives under consideration. Prioritization matrices are especially useful if problem-solving resources, such as people, time or money, are limited, or if the identified problem-solving actions or CTQs are strongly interrelated.
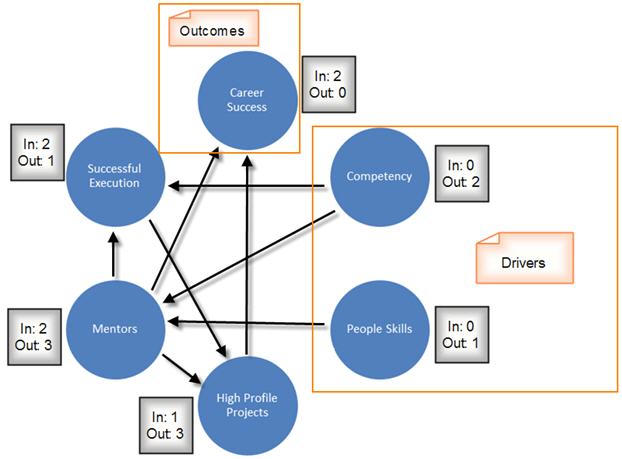
Interrelationship digraphs is a new management technique that shows cause-and-effect relationship, and help analyze the natural links between different aspects of a complex issue. It's a go-to technique for complex problems.
This technique enables team to systematically identify, analyze, and classify the cause-and-effect relationships that exist among all critical issues in such a way that key drivers become the heart of an effective solution.
If a situation become very complex, exact relationships may be difficult to determine. l.D. technique encourages team members to generate as much as idea as possible, to think in multiple directions rather than linearly.
SMED was developed by Shigeo Shingo, a Japanese industrial engineer who was extraordinarily successful helping companies reduce their changeover time. His pioneering work led to documented reductions in changeover time averaging 94% (e.g. from 90 minutes to less than 5 minutes) across a wide range of companies. SMED (Single-Minute Exchange of Dies) is a system for dramatically reducing the time it takes to complete equipment changeovers.
The essence of the SMED system is to convert as many changeover steps as possible to “external” (performed while the equipment is running), and to simplify and streamline the remaining steps. The name Single-Minute Exchange of Dies comes from the goal of reducing changeover times to “single” digits (i.e. less than 10 minutes).

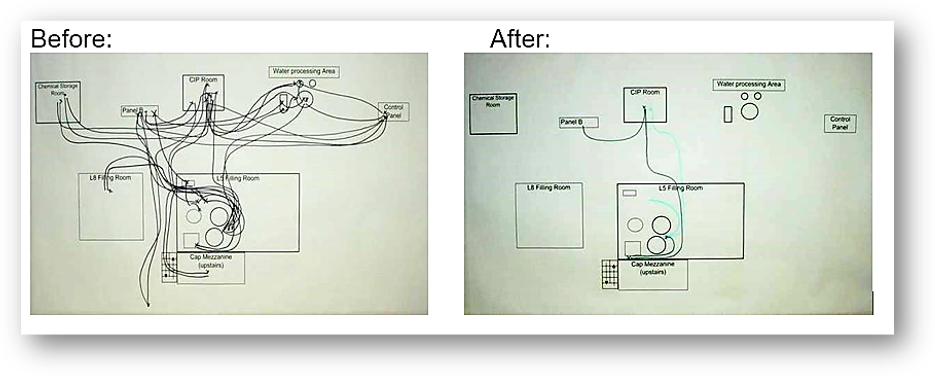
Spaghetti diagram is a visual representation using a continuous flow line tracing the path of an item or activity through a process. As a process analysis tool, the continuous flow line enables process teams to identify redundancies in the work flow and opportunities to accelerate process flow. It is a quick and easy way to track distances of parts and people on the production floor. It helps to reveal all inefficiencies of a layout.
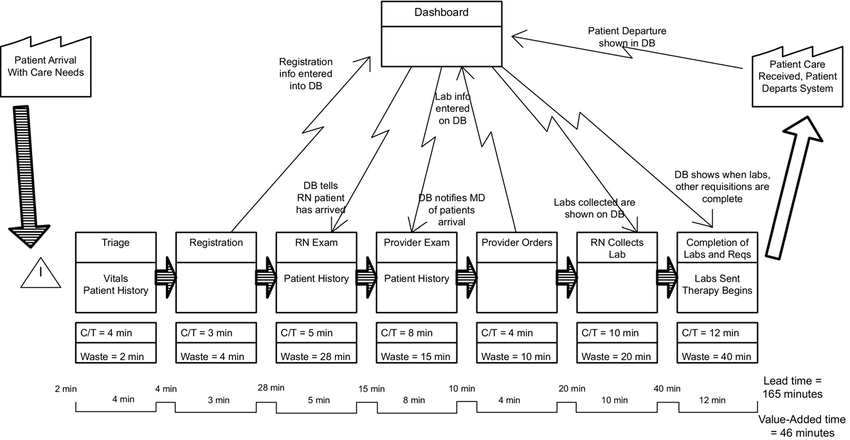
Value-stream mapping is a visual process improvement tool for analyzing the current state and designing a future state for the series of steps required to take a product or service from the beginning of the specific process down to the customer by displaying all critical steps in a specific process and quantifying the time and volume taken for each step at each stage.
Value stream maps show the flow of both materials and information as they progress through the process, hence can also be referred to as material- and information-flow mapping. The goal of value-stream mapping is simply to identify and remove or reduce "waste" in value streams resulting into an increase in efficiency of a given value stream.
VSM aids in waste removal with the intent of increasing productivity through creation of leaner operations, in turn, making waste and quality problems easily identified.
About the Author
Adebayo is a thought leader in continuous process improvement and manufacturing excellence. He is a Certified Six Sigma Master Black Belt (CSSMBB), Digital Manufacturing Professional and ISO Management Systems Lead Auditor (ISO 9001, 45001 & ISO 22000) with strong experience leading various continuous improvement initiative in top manufacturing organizations.
You can reach him here.
