Applying Interrelationship Digraphs (ID) in Process Improvement
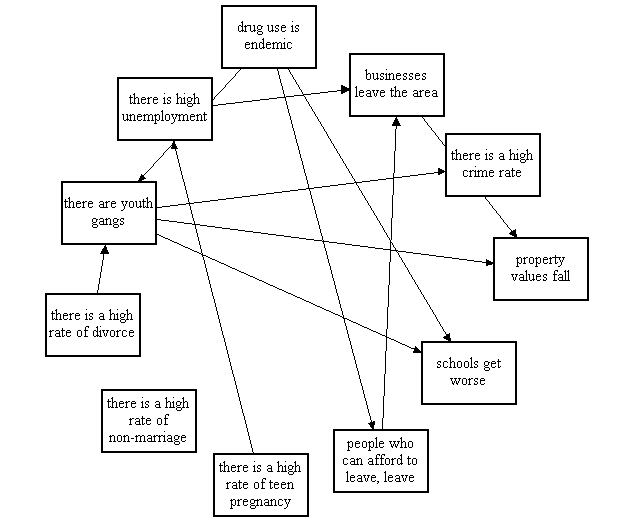
Interrelationship digraphs is a new management technique that shows cause-and-effect relationships, and help analyze the natural links between different aspects of a complex issue. It's a go-to technique for complex problems.
This technique enables team to systematically identify, analyze, and classify the cause-and-effect relationships that exist among all critical issues in such a way that key drivers become the heart of an effective solution.
If a situation become very complex, exact relationships may be difficult to determine, the lD technique encourages team members to generate as much as idea as possible, to think in multiple directions rather than linearly. It explores the cause-and-effect relationships among all the issues. It enables key issues emerge on its own without being forced by a dominant or powerful team member. It systematically surfaces the basic assumptions and reasons for disagreements among team members.
 Click Here to Join the Over 2000 Students Taking our Highly Rated Courses on Quality Assurance/Quality Control, Food Safety, Lean Six Sigma, Lean Manufacturing, Six Sigma, ISO 9001, ISO 14001, ISO 22000, ISO 45001, FSSC 22000, Product Development etc. on UDEMY.
It enables a team to identify root cause(s) even when credible data doesn’t exist. The goal is to have a workable problem solving process that will eventually indicate some key causes. In fact, the final “solution” to the problem will be determined when the team has analyzed the graph for the key causes.
The interrelationship digraph can also be referred to as a relations diagram, although there are some minor differences in the uses of the digraph.
 Click Here to Join the Over 2000 Students Taking our Highly Rated Courses on Quality Assurance/Quality Control, Food Safety, Lean Six Sigma, Lean Manufacturing, Six Sigma, ISO 9001, ISO 14001, ISO 22000, ISO 45001, FSSC 22000, Product Development etc. on UDEMY.
When to Use an Interrelationship Diagram
Interrelationship Diagram can be used:
- When trying to understand various links between ideas or cause-and-effect relationships, such as when trying to identify an area of greatest impact for improvement.
- When trying to understand and analyze complex issue for causes.
- When implementing a complex solution to a problem.
- Used in root cause analysis particularly for:
- Understanding the connection between the different aspects of the problem.
- Understanding the relationships between the problem and its possible causes that can be further analysed.

Click Here to Download Readymade Editable Toolkits & Templates on Quality Assurance/Quality Control, Lean Six Sigma, Lean Manufacturing, Six Sigma, ISO 9001, ISO 14001, ISO 22000, ISO 45001, FSSC 22000, HSSE, Project Management etc.
How to Create Interrelationship Digraphs
- Develop about 50 items that pertain to the basic problem. These probably should be on a 3” x 5” cards (called, l.D cards).
- A decision is made to either place closely related items together right away, or to shuffle the cards for a random display on a table. The random method can be justified if one wishes to uncover different ways of looking at a problem. The early placement of closely related cards together may have a tendency to bias thought patterns.
- The diagram starts with discussion regarding the placement of relationship arrows. The relationship arrow goes from the cause item to the effect item (cause —> effect). This is done for every card until completed.
- Since this technique presumes there is adequate time to study the problem at hand, several revisions can be made. The digraph can be copied onto a large sheet of paper and distributed to team members for review with the group reporting back after sometime for revisions.
- Once the revisions have been made, a final draft of the digraph is created, and an analysis can be made. The drawing of arrows leading away or to certain (l.D.) cards can lead to inferences for the team to use.
- The team will develop a consensus on the items that need to be worked on right away. These key items should be the ones with the greatest number of connecting arrows. A high number of outgoing arrows indicates a root cause or main driver. A high number of incoming arrows indicates an outcome. Select only a few key items for project work.

 Click Here to Join the Over 2000 Students Taking our Highly Rated Courses on Quality Assurance/Quality Control, Food Safety, Lean Six Sigma, Lean Manufacturing, Six Sigma, ISO 9001, ISO 14001, ISO 22000, ISO 45001, FSSC 22000, Product Development etc. on UDEMY.
About the Author
Adebayo is a thought leader in continuous process improvement and manufacturing excellence. He is a Certified Six Sigma Master Black Belt (CSSMBB) Professional and Management Systems Lead Auditor (ISO 9001, 45001, ISO 22000/FSSC 22000 etc.) with strong experience leading various continuous improvement initiative in top manufacturing organizations.
You can reach him here.
