How Process Integration Improves Plant Sustainability and Profitability
Process Integration (PI) is a holistic engineering approach that unifies different process units or streams to systematically maximize resource efficiency and minimize waste. PI encompasses methods such as Pinch Analysis (heat integration), Water Integration (water pinch), Mass Exchange Networks, Utility System Integration, and Process Intensification, often aided by digital tools (e.g. sensors, digital twins). By leveraging synergies (e.g. reusing heat or wastewater internally), PI can substantially reduce energy, water and raw material use, lower emissions and waste, and thus improve both environmental performance and profits. For example, a DOE-led PI study at a Rohm & Haas chemical plant identified ~2.2 million MMBtu/year energy savings (~45% of fuel use) and $7.7 million/yr in cost savings.
Likewise, water‐pinch studies have shown freshwater use reductions on the order of 45–56%. Typical industry results reported include 20–30% site-level energy savings, tens of percent reductions in water use, substantial cuts in raw material or waste disposal (e.g. waste streams reused rather than landfilled), and payback periods often under 2 years. Economic analyses (cost–benefit, lifecycle) typically show high return on investment for PI retrofits, especially when incentives or lean operations are considered. Implementation follows stages of screening, targeting, design, retrofit and commissioning, and requires cross-functional teamwork and training.
Barriers include organizational silos and upfront costs, which can be mitigated by strong management support, pilot studies, and aligning projects with regulatory incentives. Case studies from chemicals, petroleum refining, food processing, pulp/paper, pharmaceuticals and metals illustrate quantifiable sustainability benefits. Advanced digital tools (sensors, optimization software, machine learning) are increasingly used to monitor and control integrated systems in real time. Corporate reporting can incorporate the GHG, water and material savings from PI in sustainability metrics, advancing circular-economy goals.
This whitepaper provides an in-depth review of PI methods, their environmental and economic impacts, and practical guidance for managers to implement PI projects, including an actionable roadmap.
Click Here to Join the Over 9,000 Students Taking Highly Rated Courses in Manufacturing, Quality Assurance/Quality Control, Project Management, Engineering, Food Safety, Lean Six Sigma, Industrial Safety (HSE), Lean Manufacturing, Six Sigma, ISO 9001, ISO 14001, ISO 22000, ISO 45001, FSSC 22000, Product Development etc. on UDEMY.
Introduction and Scope of Process Integration
Definition: In chemical engineering, Process Integration (PI) is a holistic design and optimization methodology that exploits interactions between unit operations to use energy and materials more effectively and minimize costs. Unlike traditional isolated optimization of equipment, PI treats the process as a system, uncovering synergies such as using heat rejected by one unit in another. For example, waste heat from a hot stream can preheat a cold stream, reducing external energy needs. By considering new plants and retrofits alike, PI can make industries “more money from raw materials and capital assets while becoming cleaner and more sustainable”. The general IEA definition of PI is “systematic and general methods for designing integrated production systems… with special emphasis on the efficient use of energy and reducing environmental effects.”.
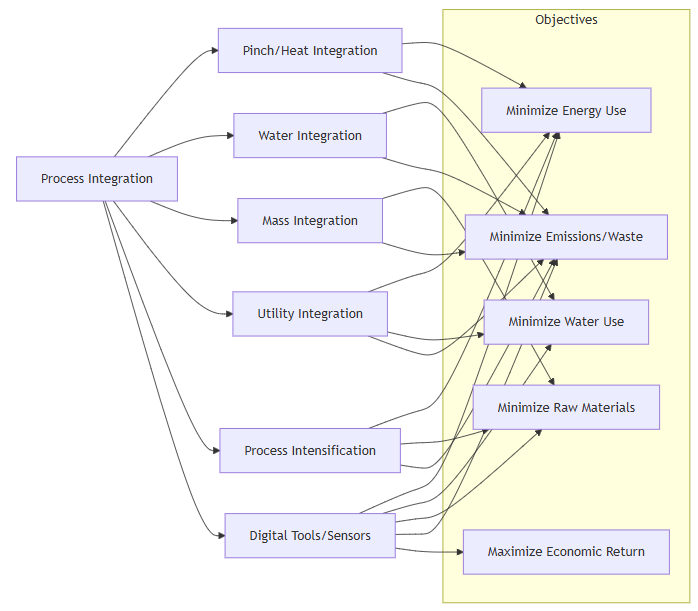
Key PI methods and related concepts include:
- Pinch Analysis / Heat Integration: Graphical/targeting technique to minimize utilities (steam, cooling) by matching hot and cold streams via heat exchangers. Pioneered by Linnhoff et al. (1970s).
- Water Integration / Water Pinch: Extended the targeting philosophy to freshwater and wastewater, identifying minimum freshwater intake and maximum reuse. Techniques include direct reuse, recycle, and regeneration of wastewater.
- Mass Integration / Material Pinch: Designing networks to reuse or recycle byproduct streams (e.g. solvents, acids) within the plant, or across processes. This covers direct recycling and mass-exchange networks (e.g. absorbent loops).
- Utility System Integration: Coordinating plant utilities (boilers, chillers, compressors) for combined heat/power (CHP), steam network balancing, heat storage, etc.
- Process Intensification: Use of advanced equipment (e.g. reactive distillation, membrane reactors, microchannel units) that combine steps or intensify transfers, yielding smaller, cleaner, more efficient processes.
- Digital PI Tools: Modern PI increasingly leverages digital twins, IoT sensors, real-time optimization and AI analytics to continuously optimize resource flows (the “digital process integration” paradigm).
Advantages: By capturing internal reuse and recycling opportunities, PI can identify significant savings that piecemeal analysis misses. For example, screening with pinch or mathematical models early in design can target minimum utility and raw usage before detailed engineering. This system-wide thinking often finds low- or no-cost measures (better heat matching, reuse streams) that cut energy and water demand. By contrast, “analysis by unit” would overlook these opportunities. In practice, PI is used both at the outset of new plant design and during retrofits of existing facilities. When integrated with simulation and optimization tools, it yields designs that meet production needs with much lower fuel, water, and waste.
Process Intensification Synergy: Notably, combining PI with process intensification multiplies benefits. Intensification strategies (e.g. combining reaction and separation) shrink equipment size and energy needs, while PI ensures any residual heat or material outputs are fully recaptured. This holistic route yields superior sustainability and economics.
Click Here to Join the Over 9,000 Students Taking Highly Rated Courses in Manufacturing, Quality Assurance/Quality Control, Project Management, Engineering, Food Safety, Lean Six Sigma, Industrial Safety (HSE), Lean Manufacturing, Six Sigma, ISO 9001, ISO 14001, ISO 22000, ISO 45001, FSSC 22000, Product Development etc. on UDEMY.
Technical Mechanisms and Resource Savings
PI reduces resource use and pollution through concrete mechanisms:
- Heat recovery: Pinch analysis designs Heat Exchanger Networks (HENs) that reuse process heat. This directly cuts steam or fuel demand. For example, retrofitting a crude distillation unit’s HEN achieved a 45% reduction in external heating/cooling utilities (saving 67.5 vs 148.6 MW utilities). This corresponded to CO₂ cuts of ~1,079 kg/h (practical option) up to 7,840 kg/h (theoretical maximum).
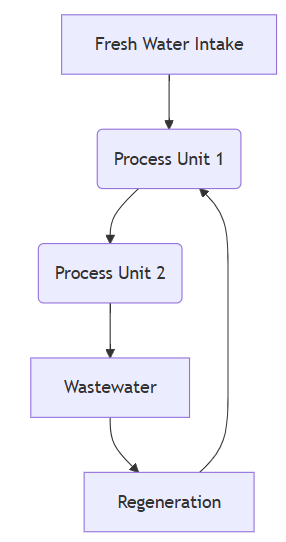
- Water reuse and regeneration: Water pinch identifies where wastewater from one unit can feed another, or be treated for reuse. In one refinery case, applying water pinch reduced fresh water use by 45–56% (saving 79–99 m³/hr) and cut oily/sanitary effluent by 31–52 m³/hr. The systematic reuse of internal wastewater both saves water and lowers effluent emissions. (See below for a schematic.)
- Raw material recycling: Mass-integration recovers chemicals or solvents from waste streams back into production. For instance, direct recycling loops waste back to the process. Mass-Exchange Networks align absorbers/strippers so that byproducts treat each other. This cuts raw feed consumption. As one review notes, mass integration “allows to recover part of the waste streams of a process and reuse them directly or after purification, thus reducing the purchase of pure raw materials and the generation of waste”.
- Utility optimization: Integrating utility systems (steam, power, cooling) improves overall efficiency. For example, balancing steam pressures, using waste heat for feedwater preheat, or installing cogeneration (CHP) can dramatically reduce purchased fuel and electricity.
- Process intensification: Converting to intensified equipment (e.g. high-gravity reactors, membrane separations, fluidized beds) inherently lowers energy and footprint. Such intensified units produce less waste heat and can enable more compact heat recovery. For example, combining reaction and distillation (reactive distillation) saves both reaction heat and separation duty.
Outcome Ranges: Literature reports typical savings: energy usage can drop ~20–45% via heat integration; water use by tens of percent (often 20–50%) with pinch methods; raw material consumption significantly lower via reuse loops; and waste emissions greatly curtailed (e.g. some studies target 60–80% reductions in waste-to-landfill). While exact values depend on plant complexity and baselines, many case studies show double-digit percentage gains in efficiency across metrics. Moreover, reducing fuel and energy use directly shrinks CO₂, NOₓ and other emissions (often ~1:1 relation between fuel saved and CO₂ cut). In summary, PI measures yield cascading benefits: saving 1 unit of steam lowers cooling, chemical, and ancillary energy uses and thus multiplies environmental gains.
Click Here to Join the Over 9,000 Students Taking Highly Rated Courses in Manufacturing, Quality Assurance/Quality Control, Project Management, Engineering, Food Safety, Lean Six Sigma, Industrial Safety (HSE), Lean Manufacturing, Six Sigma, ISO 9001, ISO 14001, ISO 22000, ISO 45001, FSSC 22000, Product Development etc. on UDEMY.
Performance Metrics and Economic Impacts
To evaluate PI projects, engineers use both engineering and economic metrics. Key performance indicators include:
- Energy Intensity: e.g. GJ or kWh per unit product. Improvements are measured in absolute reduction and percentage change. Case data: Oil and chemical plants often see 20–30% lower energy use after PI. A DOE case achieved ~38% steam usage reduction.
- Water Footprint: Cubic meters of water per product or per time. Typical PI saves up to half of freshwater intake, markedly cutting metrics like m³/ton.
- Material Efficiency: Fraction of feed converted to product. PI increases yield by recycling by-products (e.g. 5–20% less raw feed needed in some reports). Exact figures vary by process.
- Emissions and Waste: Tons CO₂ or pollutants per product. Since most emissions scale with fuel use, CO₂ often falls ~20–30% alongside energy cuts. Wastewater volume or COD/P loads similarly drop with reuse. Some waste networks target 60–80% waste elimination.
- Economic Metrics: CAPEX of retrofits (often modest relative to plant size, e.g. a few % of replacement cost), OPEX savings (fuel/water purchases), and ROI/Payback. Many implementations report payback periods < 2–3 years. For instance, a pulp mill HEN retrofit (5.8–11 MW steam saved) had payback ~1.3 years. In the Rohm & Haas case, $300k assessment led to $7.7M/yr savings (~38× return). In edible oil plants, 20–30% energy cuts translate to multi-7-figure savings for few 10⁵$ projects, often recouped in 6–18 months.
- Lifecycle Cost (LCC) and Payback: Analyses include total operating and maintenance costs over equipment life. A life-cycle perspective often solidifies the case, capturing fuel price volatility and extended benefits. Sensitivity analyses (e.g. ± fuel cost) help quantify project risk.
In practice, many PI proposals pass economic screening easily because energy prices and sustainability incentives make even low-tech efficiency highly profitable. Simple payback or discounted cash flow are used; key is that PI costs (heat exchangers, pumps, controls) are usually small relative to large fuel savings. Life-cycle costing that includes future fuel trends and CO₂ costs can only increase the attractiveness.
Click Here to Join the Over 9,000 Students Taking Highly Rated Courses in Manufacturing, Quality Assurance/Quality Control, Project Management, Engineering, Food Safety, Lean Six Sigma, Industrial Safety (HSE), Lean Manufacturing, Six Sigma, ISO 9001, ISO 14001, ISO 22000, ISO 45001, FSSC 22000, Product Development etc. on UDEMY.
Implementation Roadmap and Best Practices
Implementing PI is a staged process. A high-level roadmap may include:
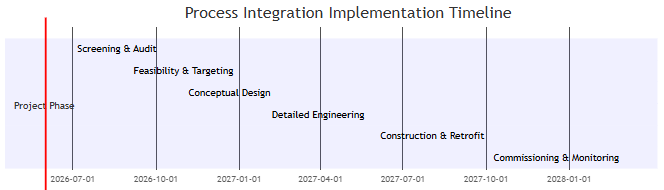
- Screening & Audit (1–3 months): Assemble cross-functional team to collect process data (flows, compositions, temperatures). Use an initial pinch screening or energy/water balance to flag high-impact areas. Evaluate quick wins and regulatory drivers.
- Targeting & Feasibility (1–3 months): Apply pinch/water-pinch/mass integration tools to set minimum utilities and water use targets. Determine material reuse limits. Estimate CAPEX vs savings to prioritize options.
- Conceptual Design (2–4 months): Develop integration schemes (heat exchanger networks, recycle loops, utility adjustments) and simulate them. Identify necessary new equipment (exchangers, regeneration units, control upgrades). Conduct preliminary cost estimates.
- Detailed Engineering (4–6 months): Finalize designs, sizing, piping, instrumentation, and control strategies. Ensure compatibility with operations. Prepare CAPEX budget and implement workflow.
- Retrofit & Construction (6–18 months): Procure equipment and install. Plan for minimal production disruption (often done in turnarounds). Commission systems (e.g. tune heat exchangers, start up recycle loops).
- Training & Monitoring: Train operators on new integrated system and control strategies. Install metering (energy, water, material flows) and use Building/Process Management Systems or DCS to track performance.
- Optimization & Continuous Improvement: Once online, fine-tune control logic (MPC, AI-based controllers) to adapt to variable loads. Schedule periodic reviews for further integration opportunities.
Best Practices: Engage stakeholders early: managers, operators, and engineers must align on goals. Use simulation and multi-disciplinary teams. Combine graphical pinch with mathematical optimization (to handle multiple contaminants or batch schedules). Training in PI methods (as in Cussler/Moggridge or Linnhoff’s Pinch Analysis texts) empowers in-house capability. Apply stepwise implementation (pilot a section first) to manage risk. Integrate PI projects into lean/six-sigma initiatives. Leverage existing standards (ISO 50001 energy management) and incentives (utility rebates) to justify projects.
Click Here to Join the Over 9,000 Students Taking Highly Rated Courses in Manufacturing, Quality Assurance/Quality Control, Project Management, Engineering, Food Safety, Lean Six Sigma, Industrial Safety (HSE), Lean Manufacturing, Six Sigma, ISO 9001, ISO 14001, ISO 22000, ISO 45001, FSSC 22000, Product Development etc. on UDEMY.
Barriers, Risks, and Mitigation
Implementing PI can face obstacles. Common barriers include:
- Organizational Silos: When engineering, production and maintenance work in isolation, system-level opportunities are missed. PI requires cross-unit collaboration.
- Lack of Data/Tools: Inadequate metering or historical data hampers analysis. Invest in temporary monitoring campaigns if needed.
- Capital and Schedule Constraints: Even if profitable, retrofits compete for capital. Focus on high-payback measures first; consider phased rollouts.
- Technical Complexity: Integrating units may introduce new operational interactions or safety concerns (e.g. recycled toxic streams). Rigorous hazard reviews and control strategies are needed.
- Regulatory/Permitting: For example, reusing wastewater may require permitting; changes to boiler or emissions units may need modification of environmental permits.
- Skills Gap: Few engineers are trained in PI methods. Providing education and using outside experts as mentors can help.
Mitigation strategies: Educate management on PI’s business case with hard data (see case studies). Start with a pilot project that delivers visible savings to build momentum. Use sensitivity analysis in planning to show robust ROI under uncertainty. Engage authorities early for permitting; highlight environmental benefits (regulators often welcome reduced effluent or emissions). Apply incremental changes where possible (e.g. add a single heat exchanger) to avoid large downtime. Finally, emphasize that PI not only saves costs but also helps meet sustainability targets (often mandated or market-driven).
Case Studies
Chemical Industry: A DOE Industrial Technologies Program assessment at Rohm & Haas (Deer Park, TX) used pinch analysis on major chemical units. It identified 2.2 million MMBtu/year fuel savings (~38% of current use) and $7.7 million/year cost savings. Key measures included heat recovery from a methyl methacrylate plant and steam balance fixes. The ~$300k study (with $100k DOE cost-share) thus promised ~20× ROI.
Petrochemical/Refining: In a crude distillation unit, pinch-based retrofit could save ~45% of cooling/heating duty, shaving 1079–7840 kg/h CO₂ emission (depending on scope). A Kuwaiti refinery pinch retrofit reportedly yielded ~$2M/yr OPEX savings. In petrochemical sites, hydrogen pinch (integrating hydrogen networks) has cut hydrogen generation CAPEX by up to 20% while meeting clean fuel specs.
Food Processing: Edible oil refineries have realized 20–30% energy cost reductions by rebalancing heat flows. Typical steps were recovering heat from bleached/deodorized oil to preheat crude, and eliminating excess refrigeration loops. The Sustenergy Solutions blog reports consistent 20%+ overall energy savings across multiple plants with fast paybacks. Similarly, water pinch has been used in breweries and dairy plants to cut water use by 30–40%.
Pulp & Paper: A Scandinavian Kraft mill applied pinch analysis and estimated 12% steam savings (18.5 MW). Two retrofit options (5.8 MW and 11 MW savings) had paybacks ~16 months. The project allowed burning less bark fuel and selling dried biomass, improving revenues and lowering CO₂ emissions. Literature shows typical pulp/paper plants can often save 15–25% of energy through integrated steam systems and secondary heat recovery, while water reuse in pulp bleaching can cut effluent loads by 20–30%.
Pharmaceuticals and Chemicals: Green chemical plants and pharma facilities use PI to minimize solvent losses and energy use. For instance, one pharma site realized >10% raw material savings by recycling a solvent stream. Also, intensified reactive distillation reduced energy by 25% versus conventional distillation+reaction. While detailed numbers vary, the trend is clear: PI/PI often doubles as pollution prevention by closing material loops.
Metals and Mining: Integrated energy management in smelters and refineries (for aluminum, steel) has led to 10–20% energy efficiency gains, partly by using waste heat boilers and optimizing gas flows. Water–energy nexus studies in mining show that reusing process water can cut overall site water demand by 30% while enabling extra hydroelectric generation from tailings flows.
These case studies underscore that all industries—from pharma to metals—benefit when PI is applied appropriately. Quantified outcomes (energy, water, cost) tend to be substantial and recurring, justifying the upfront engineering effort.
Click Here to Join the Over 9,000 Students Taking Highly Rated Courses in Manufacturing, Quality Assurance/Quality Control, Project Management, Engineering, Food Safety, Lean Six Sigma, Industrial Safety (HSE), Lean Manufacturing, Six Sigma, ISO 9001, ISO 14001, ISO 22000, ISO 45001, FSSC 22000, Product Development etc. on UDEMY.
Digital Tools, Sensing, Optimization, and Control
Modern PI increasingly leverages digital technologies. Sensors and IoT enable real-time tracking of heat, water, and material flows. For example, flowmeters and temperature sensors in heat exchangers feed data to digital twins of the plant. Digital twins (high-fidelity virtual plant models) allow engineers to simulate “what-if” changes in real time. Advanced analytics (machine learning, model predictive control) can then automatically adjust valves, compressor loads, or recycle ratios to maintain optimal integration.
For example, Adaptive Digital Twins can self-optimize and self-monitor the system, continuously learning from data. Such systems can achieve additional energy savings (reports suggest often 5–15% extra gains beyond static design) by running the plant closer to ideal targets under varying loads. Specific applications include real-time optimization of cooling towers, chiller networks, or water reuse loops with extremum-seeking controllers.
Integration with manufacturing execution systems (MES) enables alerts when energy or water use deviates from PI predictions. Overall, digital PI bridges design and operation: targets set by pinch analysis are enforced by sensors/controls on the shop floor. As one industry expert notes, combining PI with AI/ML for modeling enhances decision-making across design and operation, especially when employing lifecycle and sustainability perspectives.In practice, deploying these tools requires data infrastructure (SCADA, wireless sensor networks) and skills in data analytics. However, mature offerings now exist (e.g. Aspen HINT for pinch, or AIChE’s Digital Transformation initiatives) that embed PI in digital workflows.
Sustainability Reporting and Corporate Goals
Process Integration directly contributes to corporate sustainability metrics. Key impacts include:
- GHG Accounting: By cutting fuel (Scope 1) and purchased utilities (Scope 2), PI reduces carbon footprint. Savings (e.g. tons CO₂/year from less steam) can be tracked and reported in annual sustainability reports.
- Water Footprint: Reductions in freshwater usage and effluent discharge lower a plant’s water footprint. Many firms now quantify m³ water saved through PI projects in their CSR reports.
- Circular Economy: PI fosters circularity by turning waste into resource. For example, water reuse or byproduct recycling exemplifies “waste = feedstock.” This aligns with industry circular-economy frameworks. (The practice of direct reuse/recycle of water as soon as it’s generated is a prime circular strategy.)
- Regulatory Compliance: Many environmental standards (like EPA effluent limits or EU water directives) are easier to meet when PI lowers discharges. Hence, PI aids compliance and can be highlighted in Environmental Impact Assessments and permitting documents.
- ESG Ratings: Resource efficiency and pollution prevention score highly in ESG criteria. Documenting PI-driven improvements (e.g. “x% reduction in energy intensity since 2023”) strengthens sustainability claims.
In sum, PI results feed directly into sustainability KPIs. Forward-looking companies integrate PI into their ESG targets, often setting goals like “X% reduction in energy use by 2030” which PI programs are designed to achieve.
Click Here to Join the Over 9,000 Students Taking Highly Rated Courses in Manufacturing, Quality Assurance/Quality Control, Project Management, Engineering, Food Safety, Lean Six Sigma, Industrial Safety (HSE), Lean Manufacturing, Six Sigma, ISO 9001, ISO 14001, ISO 22000, ISO 45001, FSSC 22000, Product Development etc. on UDEMY.
Recommendations and Actionable Roadmap
For plant managers and engineers seeking to implement PI, key recommendations are:
- Adopt a System View: Break down silos. Encourage project teams that include process, energy, and environmental engineers.
- Use Proven Frameworks: Start with established techniques (pinch, water pinch, etc.) using tools like Aspen HINT or in-house spreadsheets. Consultants or academic literature (e.g. Smith 2016, El-Halwagi 2006/2017) can guide.
- Target High-Impact Areas First: Focus on high-temperature heat streams, high-volume wastewater, and bulk raw materials. These yield the largest absolute savings.
- Leverage Incentives: Seek utility rebates for efficiency, or grants (like DOE ITP) for assessments.
- Integrate PI into Continuous Improvement: Make PI part of capital planning. Even routine equipment upgrades (pump replacements, valve improvements) should consider integration.
- Build Capabilities: Train staff on PI concepts (workshops, courses) and use pilot projects to build confidence.
- Plan for Data: Install sub-metering during audits. Use the resulting data for tracking progress.
Implementation Milestones & Timeline: A typical rollout might take 1–3 years from concept to full operation. For example, a major retrofit project (phased) could span ~24 months after initial study. Short-term targets should include completing a PI audit and feasibility study (6–9 months), completing detailed design (additional 6–12 months), and retrofitting key units in the next turnaround cycle (within 18–24 months). The earlier work is started, the earlier savings are realized.In conclusion, PI projects are high-leverage investments: they often pay back in months or a few years, yet yield permanent cuts in resource use and cost. By following the rigorous approach outlined above, plants can achieve measurable sustainability and profitability gains.
References
- Fan, Y. V., Jiang, P., Popescu, A. E. P., & You, F. (2022). Sustainable cleaner production through process integration, modelling and optimisation. Journal of Cleaner Production, 380, 134849. (Emphasizes PI as a key tool unifying environmental and economic performance.)
- Klemeš, J. J., & Kravanja, Z. (2013). Forty years of heat integration: pinch analysis (PA) and mathematical programming (MP). Current Opinion in Chemical Engineering, 2(4), 461–474. (Reviews PI methods; notes PI’s role in cutting site energy demand and emissions.)
- Walmsley, T. G., Patros, P., Yu, W., Young, B. R., Burroughs, S., Apperley, M., Carson, J. K., Udugama, I. A., Aeowjaroenlap, H., Atkins, M. J., & Walmsley, M. R. W. (2024). Adaptive digital twins for energy-intensive industries and their local communities. Digital Chemical Engineering, 10, 100139. (Discusses digital twins as self-learning models for improving industrial operations.)
- Foo, D. C. Y. (2020). Systematic water system design with process integration. ChemEng Evolution. (Describes water pinch origins and how targeting reduces plant water use and costs.)
- Marchione, F. M., Hungerbuehler, K., & Papadokonstantakis, S. (2021). Mass integration for rigorous process modelling: A sequential approach for direct recycling. Frontiers in Chemical Engineering, 3, 785179. (Explains mass integration’s waste-recovery and raw materials savings.)
- Hashemi, H., Hashemi, F., Young, S., & Rosti, F. (2024). Minimization and optimization of water consumption in an oil refinery using water pinch analysis: A case study in Iran. Water Resources and Industry, 31, 100254. (Open access case: achieved 45–56% freshwater reduction and large effluent cuts with water pinch.)
- Mrayed, S., Bin Shams, M., Al-Khayyat, M., & Alnoaimi, N. (2021). Application of pinch analysis to improve the heat integration efficiency in a crude distillation unit. Cleaner Engineering and Technology, 4, 100168. (Open access case: ~45% reduction in cooling/heating utilities, CO₂ cuts ~1.1–7.8 t/h.)
- Axelsson, J., & Johnson, E. (2011). Energy efficiency through process integration in a pulp and paper mill: Pinch analysis results. In European Power and Energy Systems Conference (pp. 21–28). (Saw 18.5 MW steam potential (~12% of demand) and 1–1.5 yr payback for retrofit options.)
- Shonnard, D. R. (2019, June 27). RAPID Spotlight: Sustainability and Process Intensification. RAPID News (AIChE). (Interview: notes PI/MCPI strategies can cut energy, costs and emissions; recommends lifecycle analysis for PI decisions.)
- U.S. Department of Energy, Industrial Technologies Program. (2010). Rohm and Haas: Chemical plant uses pinch analysis to quantify energy and cost savings opportunities at Deer Park, Texas [Brochure]. (DOE case study: identified annual savings of 2.2 million MMBtu and $7.7 million.)
- Sustenergy Solutions Global Pvt. Ltd. (2026, January 14). How edible oil refineries can cut 20–30% energy costs using pinch technology. SSGGN Blog. (Industry report: multiple edible oil refineries achieved 20–30% energy savings with pinch-based integration.)