Top 5 Tools To Master When Building a Career in the Food Manufacturing Industry
Food manufacturing involves transformation of raw materials into edible and palatable products suitable for consumers. But it doesn't end there. Before, during and after all the manufacturing stages, some activities in the form of documentation, reporting, root cause analysis, among others go on behind the scenes.
An intermediate to expert level knowledge of the following tools will help you perform your duties seamlessly.

MICROSOFT OFFICE
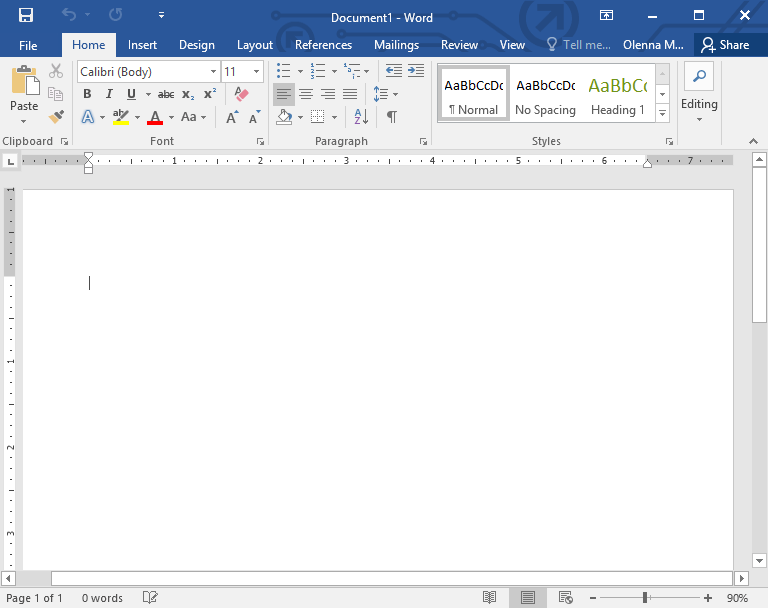
- Microsoft Word: This is very much needed for documentation, report writing, writing memos, etc in various designs. If you want to compile minutes of meeting between Production and Quality department, think of Word as your go-to tool.
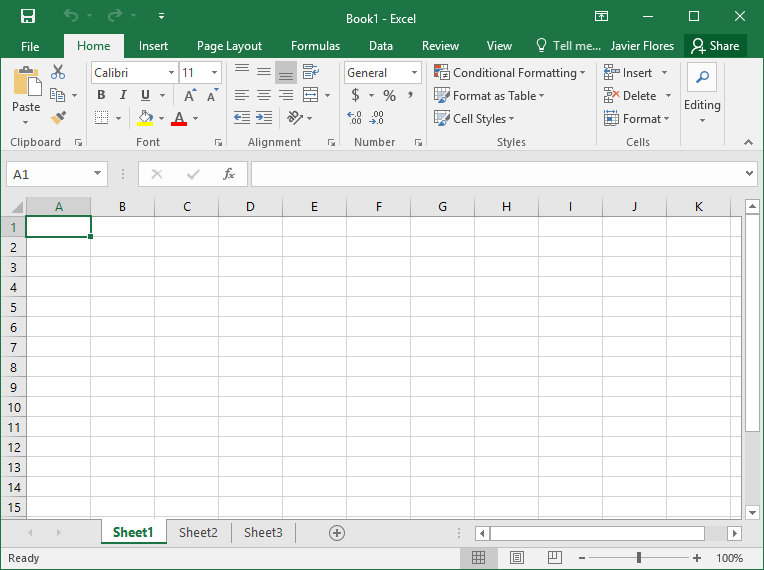
- Microsoft Excel: This is a spreadsheet basically where you can input a lot of data (words, numbers, formulae) and carry out calculations, plot graphs, pivot tables and other functions. If you want to determine the trend of analytical results, say moisture content in finished products from January to date, think of Excel.
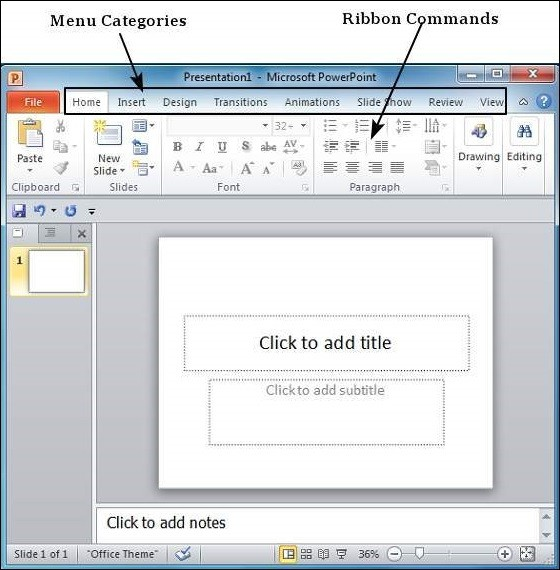
- Microsoft PowerPoint: This helps you compile a slideshow in a colourful easy to read manner. If you have a presentation to deliver to you boss or top management, I highly recommend you use PowerPoint.
- Microsoft Outlook: Yes, you will need to send mails to officially communicate relevant information with stakeholders. You must learn to use this. Outlook is equivalent to Gmail. The former is a Microsoft product while the latter is a product from Google.

ROOT CAUSE ANALYSIS
- Cause and effect diagram or Fishbone diagram or Ishikawa: This is used to derive and show at a glance the different causes to a problem. It shows the interaction of the 5 Ms of manufacturing (Man, Machine, Method, Material and Milieu) as root causes to a specific problem.
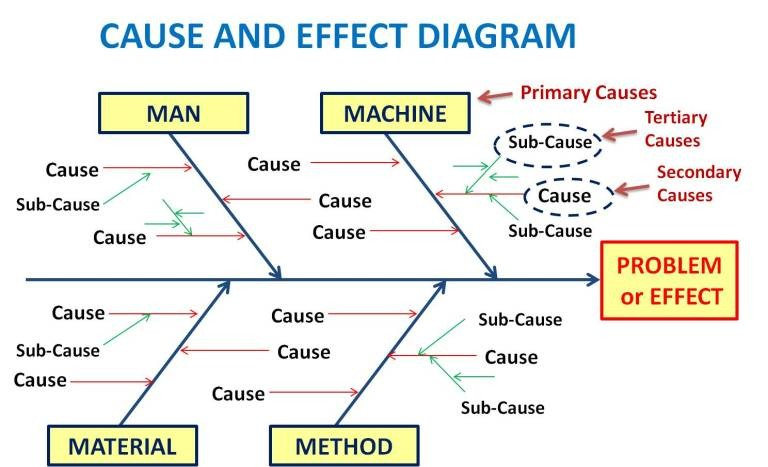
Here is a hypothetical example:
There is high bacteria count in a food product manufactured by company X. This is the problem (or the effect).
The causes will most likely be from:
- Man (unhygienic practices from personnel during handling)
- Machine (inadequate cleaning and sanitizing of processing equipment)
- Method (non-adherence to standard operating procedures)
- Material (use of raw materials with high bacteria count)
- Milieu (environmental conditions favourable for microbial growth in terms of temperature and humidity).
About the Author
Chidinma Ezinne Ochulor is a certified Food Technologist, a quality assurance professional with over 3 years' experience. She is a professional member of the Nigerian Institute of Food Science and Technology (NIFST). Reach her on LinkedIn, here.
