Aligning Manufacturing KPIs with Profitability Metrics: Best Practices
Effective manufacturing relies on more than just smooth operations and high-quality outputs—it demands a clear linkage between operational performance and the company’s bottom line. By aligning Key Performance Indicators (KPIs) with profitability metrics, manufacturers can ensure that every action on the shop floor drives financial success. This article explores why alignment matters, outlines key metrics, and presents a step‑by‑step framework to bring manufacturing KPIs into sync with profit goals.
Introduction
Manufacturers often track dozens of KPIs—equipment uptime, defect rates, throughput, and more—to monitor operational health. Meanwhile, finance teams focus on revenue, gross margin, return on assets (ROA), and cash flow. When these two worlds operate in silos, valuable insights get lost: a plant might boost throughput but erode margins through excessive scrap, or reduce costs in ways that compromise delivery. Aligning manufacturing KPIs with profitability metrics bridges this gap, driving both operational excellence and financial performance.
Core Manufacturing KPIs
Below are some of the most common KPIs used on the factory floor:
| KPI | Definition | Typical Target |
|---|---|---|
| Overall Equipment Effectiveness (OEE) | Combines availability, performance, and quality into one metric | ≥ 85% for world‑class |
| First Pass Yield (FPY) | Percentage of parts that meet quality standards on the first run | ≥ 95% |
| Cycle Time | Time taken to produce one unit | Varies by product |
| Downtime Rate | Percentage of planned production time lost to unplanned stops | ≤ 5% |
| Throughput | Number of units produced per time period | Business‑specific |
| Scrap Rate | Percentage of materials discarded as waste | ≤ 2% |
Key Profitability Metrics
By focusing on these key profitability metrics—and understanding how they interrelate—you transform raw operational data into actionable financial insight, ensuring that every production decision moves the needle on your company’s bottom line.
Click Here to Download Readymade Lean Manufacturing, Six Sigma, Lean Six Sigma, ISO 9001, ISO 14001, ISO 22000, ISO 45001, FSSC 22000, HACCP, Food Safety & Integrated Management Systems (IMS) Templates.
1. Gross Margin
Definition

- Revenue: Total sales from manufactured goods.
- COGS: Direct costs of production (materials, direct labor, manufacturing overhead).
What It Reveals
– How efficiently you convert raw materials and labor into finished goods.
– The “buffer” you have before covering operating expenses and overhead.
Benchmarks
– Varies by industry: 20–40 % in heavy manufacturing; 40–60 % in light/precision manufacturing.
– Track by product line to spot low‑margin SKUs.
2. Operating Margin
Definition
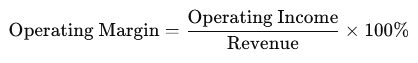
- Operating Income: Gross profit minus all operating expenses (SG&A, R&D, maintenance, utilities).
What It Reveals
– Profitability after overhead and day‑to‑day expenses.
– Ability to scale and control indirect costs.Usage Tip
– Compare against peers or across plants to identify inefficiencies in overhead allocation.
3. Contribution Margin
Definition
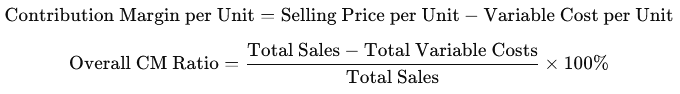
What It Reveals
– How much “headroom” each unit sale provides toward covering fixed costs and profit.
– Guides pricing, make‑vs‑buy decisions, and product mix optimization.
4. Return on Assets (ROA)
Definition
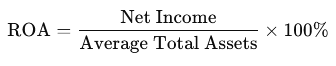
- Average Total Assets: (Beginning + Ending Assets) ÷ 2.
What It Reveals
– How effectively the plant turns invested capital (equipment, inventory, facilities) into net profit.
– Drives capital‐allocation decisions and modernization investments.
Target
– 5–15 % is typical; higher indicates better utilization of assets.
Click Here to Download Readymade Lean Manufacturing, Six Sigma, Lean Six Sigma, ISO 9001, ISO 14001, ISO 22000, ISO 45001, FSSC 22000, HACCP, Food Safety & Integrated Management Systems (IMS) Templates.
5. Return on Invested Capital (ROIC)
Definition

- Invested Capital: Total debt + shareholders’ equity – non‐operating assets.
What It Reveals
– Profitability relative to all capital providers.
– Better indicator than ROA when debt levels vary.
6. Inventory Turnover
Definition
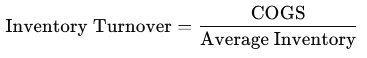
What It Reveals
– How quickly raw materials and finished goods move through the system.
– Impacts both carrying costs and working capital efficiency.Best Practice
– Segment by raw materials vs. WIP vs. finished goods to pinpoint bottlenecks.
7. Cash Conversion Cycle (CCC)
Definitio
- DIO: (Average Inventory ÷ COGS) × 365
- DSO: (Average Receivables ÷ Revenue) × 365
- DPO: (Average Payables ÷ COGS) × 365
What It Reveals
– How long cash is tied up from purchase of inputs to collection of sales.
– A shorter CCC frees up working capital for reinvestment or debt reduction.
8. EBITDA Margin
Definition

- EBITDA: Earnings before interest, taxes, depreciation, and amortization.
What It Reveals
– Operating profitability independent of capital structure and non‑cash charges.
– Useful for comparing plants or divisions with different asset‐intensity.
9. Economic Value Added (EVA)
Definition

- WACC: Weighted average cost of capital.
What It Reveals
– True economic profit after covering the cost of all capital.
– A positive EVA means you’re creating value for shareholders.
Click Here to Download Readymade Lean Manufacturing, Six Sigma, Lean Six Sigma, ISO 9001, ISO 14001, ISO 22000, ISO 45001, FSSC 22000, HACCP, Food Safety & Integrated Management Systems (IMS) Templates.
10. Cost per Unit
Definition
What It Reveals
– Direct measurement of manufacturing efficiency.
– Tracking over time shows impact of productivity improvements or rising input costs.
Why Alignment Matters
Aligning manufacturing KPIs with profitability metrics is critical because it ensures that what you measure on the shop floor directly contributes to the company’s financial health. Here’s why this alignment matters:
1. Holistic Decision‑Making
When operational KPIs (like OEE or scrap rate) and financial metrics (like gross margin or ROA) speak the same language, decisions become truly end‑to‑end. Rather than optimizing throughput at the expense of rising waste costs, you can balance speed, quality, and cost—driving improvements that boost both output and margin.
2. Resource Optimization
Every capital dollar and labor hour is finite. By linking KPIs such as downtime rate or cycle time to profitability outcomes (for example, reduced maintenance-related costs or higher contribution margins), you prioritize projects with the biggest financial return. This prevents investment in “shiny” technologies that have little bottom‑line impact.
3. Cross‑Functional Collaboration
Operations, finance, procurement, and sales often work in silos with different scorecards. Alignment fosters a common dashboard and language, so teams jointly own targets. For instance, procurement can see how raw‑material yield (an operational KPI) feeds into inventory turnover and cash conversion cycle, and then into working‑capital requirements.
4. Transparent Accountability
When frontline teams understand exactly how their daily performance—say, first‑pass yield—translates into profit dollars, motivation and ownership rise. Scorecards that merge KPIs and profit metrics make it clear who’s responsible for what, reducing finger‑pointing and driving continuous improvement.
5. Early Warning & Risk Mitigation
Leading operational indicators (machine availability, maintenance compliance) can signal profit risk before it shows up in lagging financials. If an uptick in unplanned downtime is mapped to an expected margin erosion, you can take corrective action proactively, rather than scrambling after the quarter’s results come in.
6. Strategic Agility
Aligned metrics let you test new strategies—like a shift to higher‑mix, lower‑volume production—and immediately see the P&L impact. This nimbleness is vital in today’s rapidly changing markets, where speed and cost competitiveness make the difference between winning and losing.
Click Here to Download Readymade Lean Manufacturing, Six Sigma, Lean Six Sigma, ISO 9001, ISO 14001, ISO 22000, ISO 45001, FSSC 22000, HACCP, Food Safety & Integrated Management Systems (IMS) Templates.
Framework for Alignment
- Map Causal Relationships
- Draw a value‐stream map linking operational activities (e.g., setup reductions) to cost savings.
- Identify how each KPI drives revenue or reduces expense.
- Select Leading and Lagging Indicators
- Leading KPIs (e.g., maintenance compliance) predict future profitability.
- Lagging Metrics (e.g., gross margin) confirm financial outcomes.
- Set Balanced Targets
- Ensure KPI targets propel profitability targets: e.g., reduce downtime by 10 % to improve OEE, yielding a 2 % margin increase.
- Develop a Unified Scorecard
- Integrate operational KPIs and profit metrics into a single dashboard.
- Use traffic‑light indicators (green/yellow/red) to flag misalignments in real time.
- Implement Continuous Review Cycles
- Monthly or weekly cross‑functional meetings to review scorecard performance.
- Root‑cause analysis when profit isn’t tracking alongside KPIs.
Steps to Implement Alignment
- Engage Stakeholders
- Form a steering committee: operations, finance, supply chain, and IT.
- Data Integration
- Link MES/SCADA systems with ERP/financial systems for seamless data flow.
- Define Clear Metrics
- Standardize KPI definitions across plants and departments.
- Translate to Action Plans
- For each KPI gap, assign owners, timelines, and improvement actions.
- Train and Communicate
- Educate teams on how their daily tasks impact profitability.
- Publish scorecards and highlight success stories.
- Review and Refine
- Quarterly audit of the alignment process: eliminate metrics that don’t drive profit and introduce new ones as business needs evolve.
Click Here to Download Readymade Lean Manufacturing, Six Sigma, Lean Six Sigma, ISO 9001, ISO 14001, ISO 22000, ISO 45001, FSSC 22000, HACCP, Food Safety & Integrated Management Systems (IMS) Templates.
Case Study
A mid‑sized automotive parts manufacturer noticed high OEE but stagnant gross margins. Through alignment analysis, they discovered excessive setup changeovers (leading KPI) driving overtime costs (profitability impact). By investing in SMED (Single‑Minute Exchange of Dies) training, they reduced changeover time by 30 %. OEE climbed 5 %, overtime dropped 15 %, and gross margin improved by 3 % within six months.
Best Practices and Pitfalls
- Avoid Metric Overload: Track only KPIs with direct profit impact.
- Beware of Suboptimization: Improving one KPI (e.g., throughput) should not worsen another critical metric (e.g., scrap rate).
- Champion Data Quality: Inaccurate data ruins trust—ensure real‐time, validated inputs.
- Incentivize Integrated Goals: Reward teams for achieving both operational and financial targets.
Conclusion
Aligning manufacturing KPIs with profitability metrics transforms operational excellence into tangible financial gains. By adopting a structured framework—mapping causal links, integrating data, and fostering collaboration—manufacturers can ensure every factory improvement contributes to the company’s bottom line. The ultimate reward is a leaner, more agile operation that not only produces efficiently but also maximizes profitability.
Click HERE to download or any of the following documents:
Integrated Management Systems (IMS) Implementation
IATF 16949 Automotive Quality Management Implementation Kit
ISO/IEC 17025 Laboratory Management System Implementation Kit
HACCP Implementation Kit
ISO 9001 Quality Management Systems (QMS) Implementation
ISO 22000 Food Safety Management Systems (FSMS) Implementation
Food Safety Systems Certification (FSSC) 22000 v5 Implementation
ISO 14001 Environmental Management Systems (EMS) Implementation
ISO 45001 Occupational Health & Safety Management Systems (OH&SMS) Implementation
ISO 50001 Energy Management Systems (EnMS) Implementation
Industrial Health, Safety & Environmental Management (HSE) Kit
Process Manuals
SON Compliance Documentation Kit
NAFDAC Compliance Documentation Kit
QA/QC Documentation Kit
Equipment Maintenance Documentation Kit
Production Management Documentation Kit
Production, Quality Control / Equipment Maintenance Kit
Lean Six Sigma
Lean Management/Manufacturing
Six Sigma Kit
Supplier Quality and Compliance Management (SQCM) Kit
Risk Management