Control Limits Vs Specification Limits: Meaning, Differences & their Influence on Product Quality
People often confuse control limits with specification limits, and are often discussed as if they mean the same and can be interchanged. On the contrary, control limits and specification limits are completely different concepts. They have no relationship. They are not interchangeable.
Specification limits refers to the targets set by the customer or market performance or internal target for the process/product. It is the result intended on the metric that is measured. They do not determine if a process is in control. On the other hand, control limits are the indicators of the variation in the performance of the process. It is the real time value, the actual values that the process is operating on. They give indication if a process is in control or not.
While control limits are calculated from process data for a particular control chart, with X-bar chart and an Individual measurements chart having different limits, specification limits are chosen in quite a number of ways. They apply to the individual items being measured and can be applied on histograms, box plots, or probability plots.

Confusing control limits with specification limits leads to dangerous mistakes including using specification limit values instead of control limit values on an X-bar chart or an Individuals chart. One should not even consider using specification limit values on an Individuals chart. One or both of the following errors are bound to occur if specification limit values are used instead of control limits values, unless the specification and control limit values are identical:
- First, the control limits are set too tightly: This usually results into over-adjustment and tampering of the process. Unplanned tampering adds to process variation, resulting in lower quality and higher costs, which are both unfavorable situations.
- Second, the control limits are set too loosely: Process change signals are ignored and chances for process improvement are missed, resulting into additional process variation, lower quality, and higher costs all which can easily be avoided.
The table below shows the clear differences between control limits and specification limits and their point of application:
Control Limits | Specification Limits |
Represents the process voice | Stands for the voice of the customer |
Gotten from process data | Defined by the customer |
Appear on control charts | Appear on histograms and related tools |
Apply to subgroups | Apply to items |
Serves as guide for process actions | Separate good items from bad |
Represents how the process is behaving | Represents what we want the process to do |
Control Limits and Control Charts
A control chart is simply a line graph showing a clear, graphical picture of what is happening in production process with respect to time. It is an important tool for statistical process or quality control. The control chart is made up of two (2) parts, UCL & LCL. UCL represents upper control limit, and LCL represents lower control limit. They both indicate whether any variation in the process is natural or caused by a specific, abnormal event that can affect the quality of the finished product.
If a process is in control, its control chart exhibit a natural pattern and any variation in the process, known as common cause variation, will produce data values within the upper and lower control limits. However, if abnormal or special cause variation occurs, data values are produced outside the control limits, with "out of control points" on the control chart.
How to Calculate Control Limits
First calculate the Center Line which equals either the average or median of your data. Second calculate sigma. The formula for sigma varies depending on the type of data you have which depends on whether the data is continuous or discrete. Third, calculate the sigma lines. These are ± 1 sigma, ± 2 sigma and ± 3 sigma from the center line.
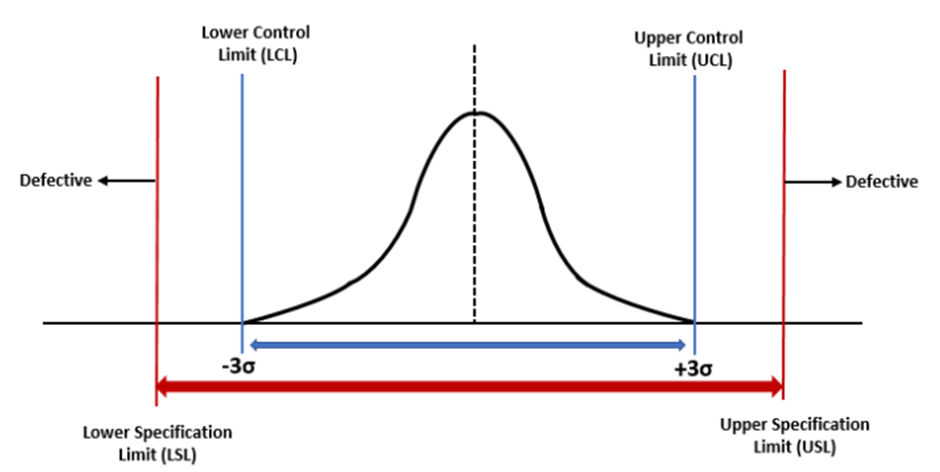
+ 3 sigma = Upper Control Limit (UCL)
- 3 sigma = Lower Control Limit (LCL)

Specification Limits
Customers set the limit on the product characteristics that define whether the product will work and not. If a product falls outside of the specification limits as defined by the customers, we assume that the customer will reject the product. However, if a product falls between the USL and LSL, then the product is said to be meeting the customer requirement. Specification limits helps to determine the process capability and the sigma value. Specification limits are best set in the design phase of the product life cycle.
Upper Specification Limit (USL) represents the highest limit a customer would accept, while Lower Specification Limit (LSL) shows the lowest limit a customer would accept.
They do not determine if a process is in control.
Credit: sixsigmastudyguide
About the Author
Adebayo is a thought leader in continuous process improvement and manufacturing excellence. He is a Certified Six Sigma Master Black Belt (CSSMBB), Digital Manufacturing Professional and Management Systems Lead Auditor (ISO 9001, 45001 & ISO 22000) with strong experience leading various continuous improvement initiative in top manufacturing organizations.
You can reach him here.
