Process Capability Explained
A process can be defined as a sequence of procedures, operations or steps that convert inputs into outputs. Every process has certain amount of variation associated with them which can be measured, monitored, reduced and/or controlled. By taking accurate measurements using reliable, well-maintained equipment, variation in a process can have very little or no impact on the quality of the output hence, able to produce acceptable product on a consistent basis.
Process Capability Defined
Process capability is defined as a statistical measure of the process variability of a given characteristic which can be used to assess the ability of a process to meet specifications. To determine how a process is operating, we can calculate:
- Process Capability (Cp)
- Process Capability Index (Cpk)
- Preliminary Process Capability (Pp)
- Preliminary Process Capability Index (Ppk)
The Cp and Cpk indices are used in evaluating existing, an already established process in statistical control. While the Pp and Ppk indices are used in evaluating a new process or one that is not in statistical control. Cp determines if a process is capable of making parts within specifications and Cpk determines if the process is centralized between the specification limits.

The Cp index is a fundamental indication of process capability which is calculated using the specification limits and the standard deviation of the process. Most organizations require that the process Cp = 1.33 or greater. The Cpk index on the other hand, examines how close a process is performing to the specification limits putting into consideration the common process variation. The larger the value of the Cpk, the closer the mean of the data is to the target value. Cpk can be calculated using the specification limits, standard deviation or sigma, and the mean value. The value should be between 1 and 3. If the value is less than 1, the process is in need of improvement.
Accurate process capability study depends upon four basic assumptions regarding the data:
- No special causes of variation in the process.
- Process is in a state of statistical control.
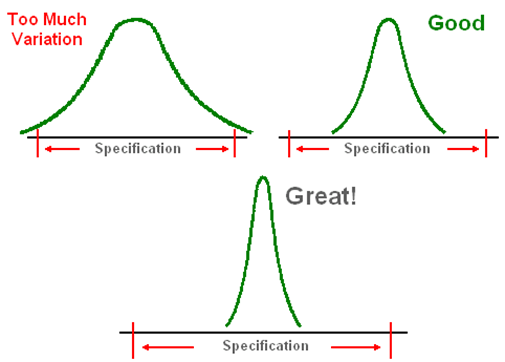
- The data used for study fits a Normal distribution, exhibiting a bell shaped curve and can be calculated to +/- 3 sigma.
- The sample data is true representative of the population randomly collected from a large production run
Why Measure Process Capability
Monitoring process capability allows the manufacturing process performance to be evaluated and adjusted as needed in order to assure that products meet the design or customer’s requirements. When used effectively, the information derived from the study can help reduce waste, improve product quality and consistency, lower cost of manufacturing and the cost of poor quality.
To determine how a process is operating, we can calculate:
- Process Capability Index (Cpk).
- Process Capability (Cp).
Calculating Cpk
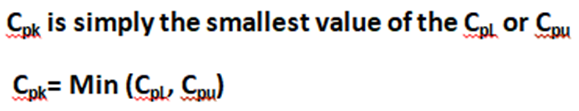
Cpk are classified into two; the upper and the lower denoted Cpu and CpL respectively.
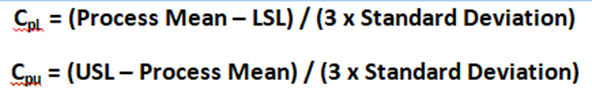
We are dividing by 3 because specification limit has an upper bound and a lower bound and since 6 sigmas (i.e. 6 standard deviations) account for nearly all eventualities on a process (assuming normal distribution), hence dividing by 3 enables us to look at only one side of the distribution.


Click Here to Download Readymade Editable Toolkits & Templates on Quality Assurance/Quality Control, HSE, Lean Six Sigma, Lean Manufacturing, Six Sigma, ISO 9001, ISO 14001, ISO 22000, ISO 45001, FSSC 22000, HSSE, Project Management etc.
Calculating Cpk using a Z Value
Cpk can be determined by dividing the Z score by 3.Z = x – mean of the population / standard deviation.

Interpretation of Cpk & Centered Processes
- If a process is perfectly centered, it has a Cp of 1 indicating that the mean was 3 standard deviations (sigma) away from the upper limit and the lower limit.
- And, a perfectly centered process a process who has a mean exactly in between the 2 specification limits will have a Cpk of 1.
Deductions from the Values of Cpk
- Cpk measures how close a process is performing compared to its specification limits and accounting for the inherent process variability.
- The larger the Cpk value, the less likely the item will be outside the specification limits.
- When Cpk is negative, the process under study will produce output that is outside the customer specification limits.
- Cpk is negative when the mean of the process is outside the customer specification limits.
- At least Cpk = 1.33 [4 sigma] or higher is required to satisfy most customers.
- Cpk do have upper and lower value reported. If the upper value is 2 and the lower is 1, we say it has been shifted to the left.
Cpk Values Cpk = Negative number, process is out of customer’s specification.
Cpk = 0.5, good chance of process meeting customer’s specification.
Cpk = 1, process about meeting customer’s specification.
Cpk = 2, Great! Process meets customer’s specification but can be improved upon.
Cpk =3, Excellent result.
Calculating Cp Cp does not account for centering.
Cp = (USL – LSL) / ( 6 x σr ) Cp = (USL – LSL) / (6 x R Bar / d2) Cp for Process Mean close to USL
If Process Mean (I.e. central tendency) is closer to the USL, use: [USL – X (bar) ] / [3 x R Bar / d2], where X (bar) is the Process Mean.
Cp for Process Mean close to LSL If Process mean (i.e. central tendency) is closer to the LSL, use: [x(bar) – LSL ] / [3 x R Bar / d2], where x(bar) is the Process Mean.
Capability Ratio Cr The inverse of Cp equals the Capability Ratio (Cr) Cr = 1/ Cp = ( 6 x σr ) / (USL – LSL)
If Cr < 0.75, the process is capable If Cr = 0.75 – 1.00, the process is capable with tight control.
If Cr >1, the process is not capable.
Conclusion on Cp & Cpk
- If Cp == Cpk, then the process is perfectly centered and, if process is perfectly centered, Cp == Cpk.
- Cpk can never be larger than Cp, because Cpk accounts for centering (while Cp does not),
- Both processes are assumed stable.
Control Limits vs Specification Limits
People often confuse control limits with specification limits, and are often discussed as if they mean the same and can be interchanged. On the contrary, control limits and specification limits are completely different concepts. They have no relationship. They are not interchangeable.
Specification limits refers to the targets set by the customer or market performance or internal target for the process/product. It is the result intended on the metric that is measured. They do not determine if a process is in control. On the other hand, control limits are the indicators of the variation in the performance of the process. It is the real time value, the actual values that the process is operating on. They give indication if a process is in control or not.
While control limits are calculated from process data for a particular control chart, with X-bar chart and an Individual measurements chart having different limits, specification limits are chosen in quite a number of ways. They apply to the individual items being measured and can be applied on histograms, box plots, or probability plots.
Click Here to Download Readymade Editable Toolkits & Templates on Quality Assurance/Quality Control, HSE, Lean Six Sigma, Lean Manufacturing, Six Sigma, ISO 9001, ISO 14001, ISO 22000, ISO 45001, FSSC 22000, HSSE, Project Management etc.
Confusing control limits with specification limits leads to dangerous mistakes including using specification limit values instead of control limit values on an X-bar chart or an Individuals chart. One should not even consider using specification limit values on an Individuals chart. One or both of the following errors are bound to occur if specification limit values are used instead of control limits values, unless the specification and control limit values are identical:
- First, the control limits are set too tightly: This usually results into over-adjustment and tampering of the process. Unplanned tampering adds to process variation, resulting in lower quality and higher costs, which are both unfavorable situations.
- Second, the control limits are set too loosely: Process change signals are ignored and chances for process improvement are missed, resulting into additional process variation, lower quality, and higher costs all which can easily be avoided.
The table below shows the clear differences between control limits and specification limits and their point of application:
| Control Limits | Specification Limits |
| Represents the process voice | Stands for the voice of the customer |
| Gotten from process data | Defined by the customer |
| Appear on control charts | Appear on histograms and related tools |
| Apply to subgroups | Apply to items |
| Serves as guide for process actions | Separate good items from bad |
| Represents how the process is behaving | Represents what we want the process to do |
Control Limits and Control Charts
A control chart is simply a line graph showing a clear, graphical picture of what is happening in production process with respect to time. It is an important tool for statistical process or quality control. The control chart is made up of two (2) parts, UCL & LCL. UCL represents upper control limit, and LCL represents lower control limit. They both indicate whether any variation in the process is natural or caused by a specific, abnormal event that can affect the quality of the finished product.
If a process is in control, its control chart exhibit a natural pattern and any variation in the process, known as common cause variation, will produce data values within the upper and lower control limits. However, if abnormal or special cause variation occurs, data values are produced outside the control limits, with "out of control points" on the control chart.
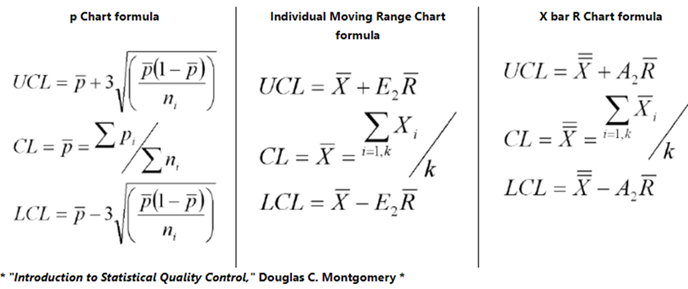
How to Calculate Control Limits
First calculate the Center Line which equals either the average or median of your data. Second calculate sigma. The formula for sigma varies depending on the type of data you have which depends on whether the data is continuous or discrete. Third, calculate the sigma lines. These are ± 1 sigma, ± 2 sigma and ± 3 sigma from the center line.
+ 3 sigma = Upper Control Limit (UCL)
- 3 sigma = Lower Control Limit (LCL)
Specification Limits
Customers set the limit on the product characteristics that define whether the product will work and not. If a product falls outside of the specification limits as defined by the customers, we assume that the customer will reject the product. However, if a product falls between the USL and LSL, then the product is said to be meeting the customer requirement.
Specification limits helps to determine the process capability and the sigma value. Specification limits are best set in the design phase of the product life cycle. Upper Specification Limit (USL) represents the highest limit a customer would accept, while Lower Specification Limit (LSL) shows the lowest limit a customer would accept. They do not determine if a process is in control.

About the Author
Olanrewaju, Adebayo Bamidele is a Lead Auditor of ISO 9001, FSSC 22000 / ISO 22000, 14001 & 45001 Management Systems, Certified Six Sigma Master Black Belt (CSSMBB), process engineer, and quality management professional with strong working experience and proven skills in manufacturing excellence, ISO management systems implementation, lean / digital manufacturing, and project management.
Adebayo is a Corporate Member of American Institute of Chemical Engineers (AIChE), Associate Member, the Institution of Chemical Engineers (IChemE), Corporate Member, Nigerian Society of Engineers (NSE), Corporate Member, Nigerian Society of Chemical Engineers (NSChE), Associate Member, Nigerian Institute of Management (NIM), and Associate Member, Institute of Strategic Management of Nigeria (ISMN).
He is an author of over 15 books and has published over 45 online courses on various e-learning platforms including Udemy, Alison, Learnformula & Study Plex.
You can reach him, here.
